Workalizer Weekly Updates: Streamlined Google Workspace Integration & Enhanced Reporting
Welcome to Workalizer's weekly update! We're excited to share the meaningful enhancements we rolled out between May 11th and May 17th, 2026. This past week, our focus was on making your Workalizer experience even smoother, from how you first join us to how you interact with your critical data. We've introduced features that simplify access and refine your data insights, helping you better understand team dynamics and productivity, including crucial metrics like your gmeet attendance report and broader insights relevant to an alert center google workspace strategy.
Seamless Onboarding: Connect with Google in a Snap
Getting started with Workalizer has never been easier. We're thrilled to announce a significant upgrade to our public site: direct Google Sign-in functionality. This new feature allows prospective users to create an account and log in using their existing Google credentials, drastically reducing friction during the onboarding process. No more remembering new passwords or filling out lengthy registration forms – just a quick, secure click, and you're in!
This enhancement is particularly beneficial for organizations already deeply integrated with Google Workspace. By leveraging your Google account, you can transition from exploring Workalizer to actively using it in mere moments, setting the stage for a more productive analytical journey. This streamlined access is a cornerstone of our commitment to providing an intuitive and efficient platform for all users, especially those managing complex team environments and needing insights from platforms like Google Meet.
Imagine discovering Workalizer, seeing its potential for tracking team collaboration and meeting effectiveness, and then being able to jump straight into setting up your workspace with just one click. This is the kind of effortless experience we strive for, ensuring you can focus on what truly matters: understanding your team's work patterns and optimizing productivity.
Enhanced Data Visualization for Deeper Insights
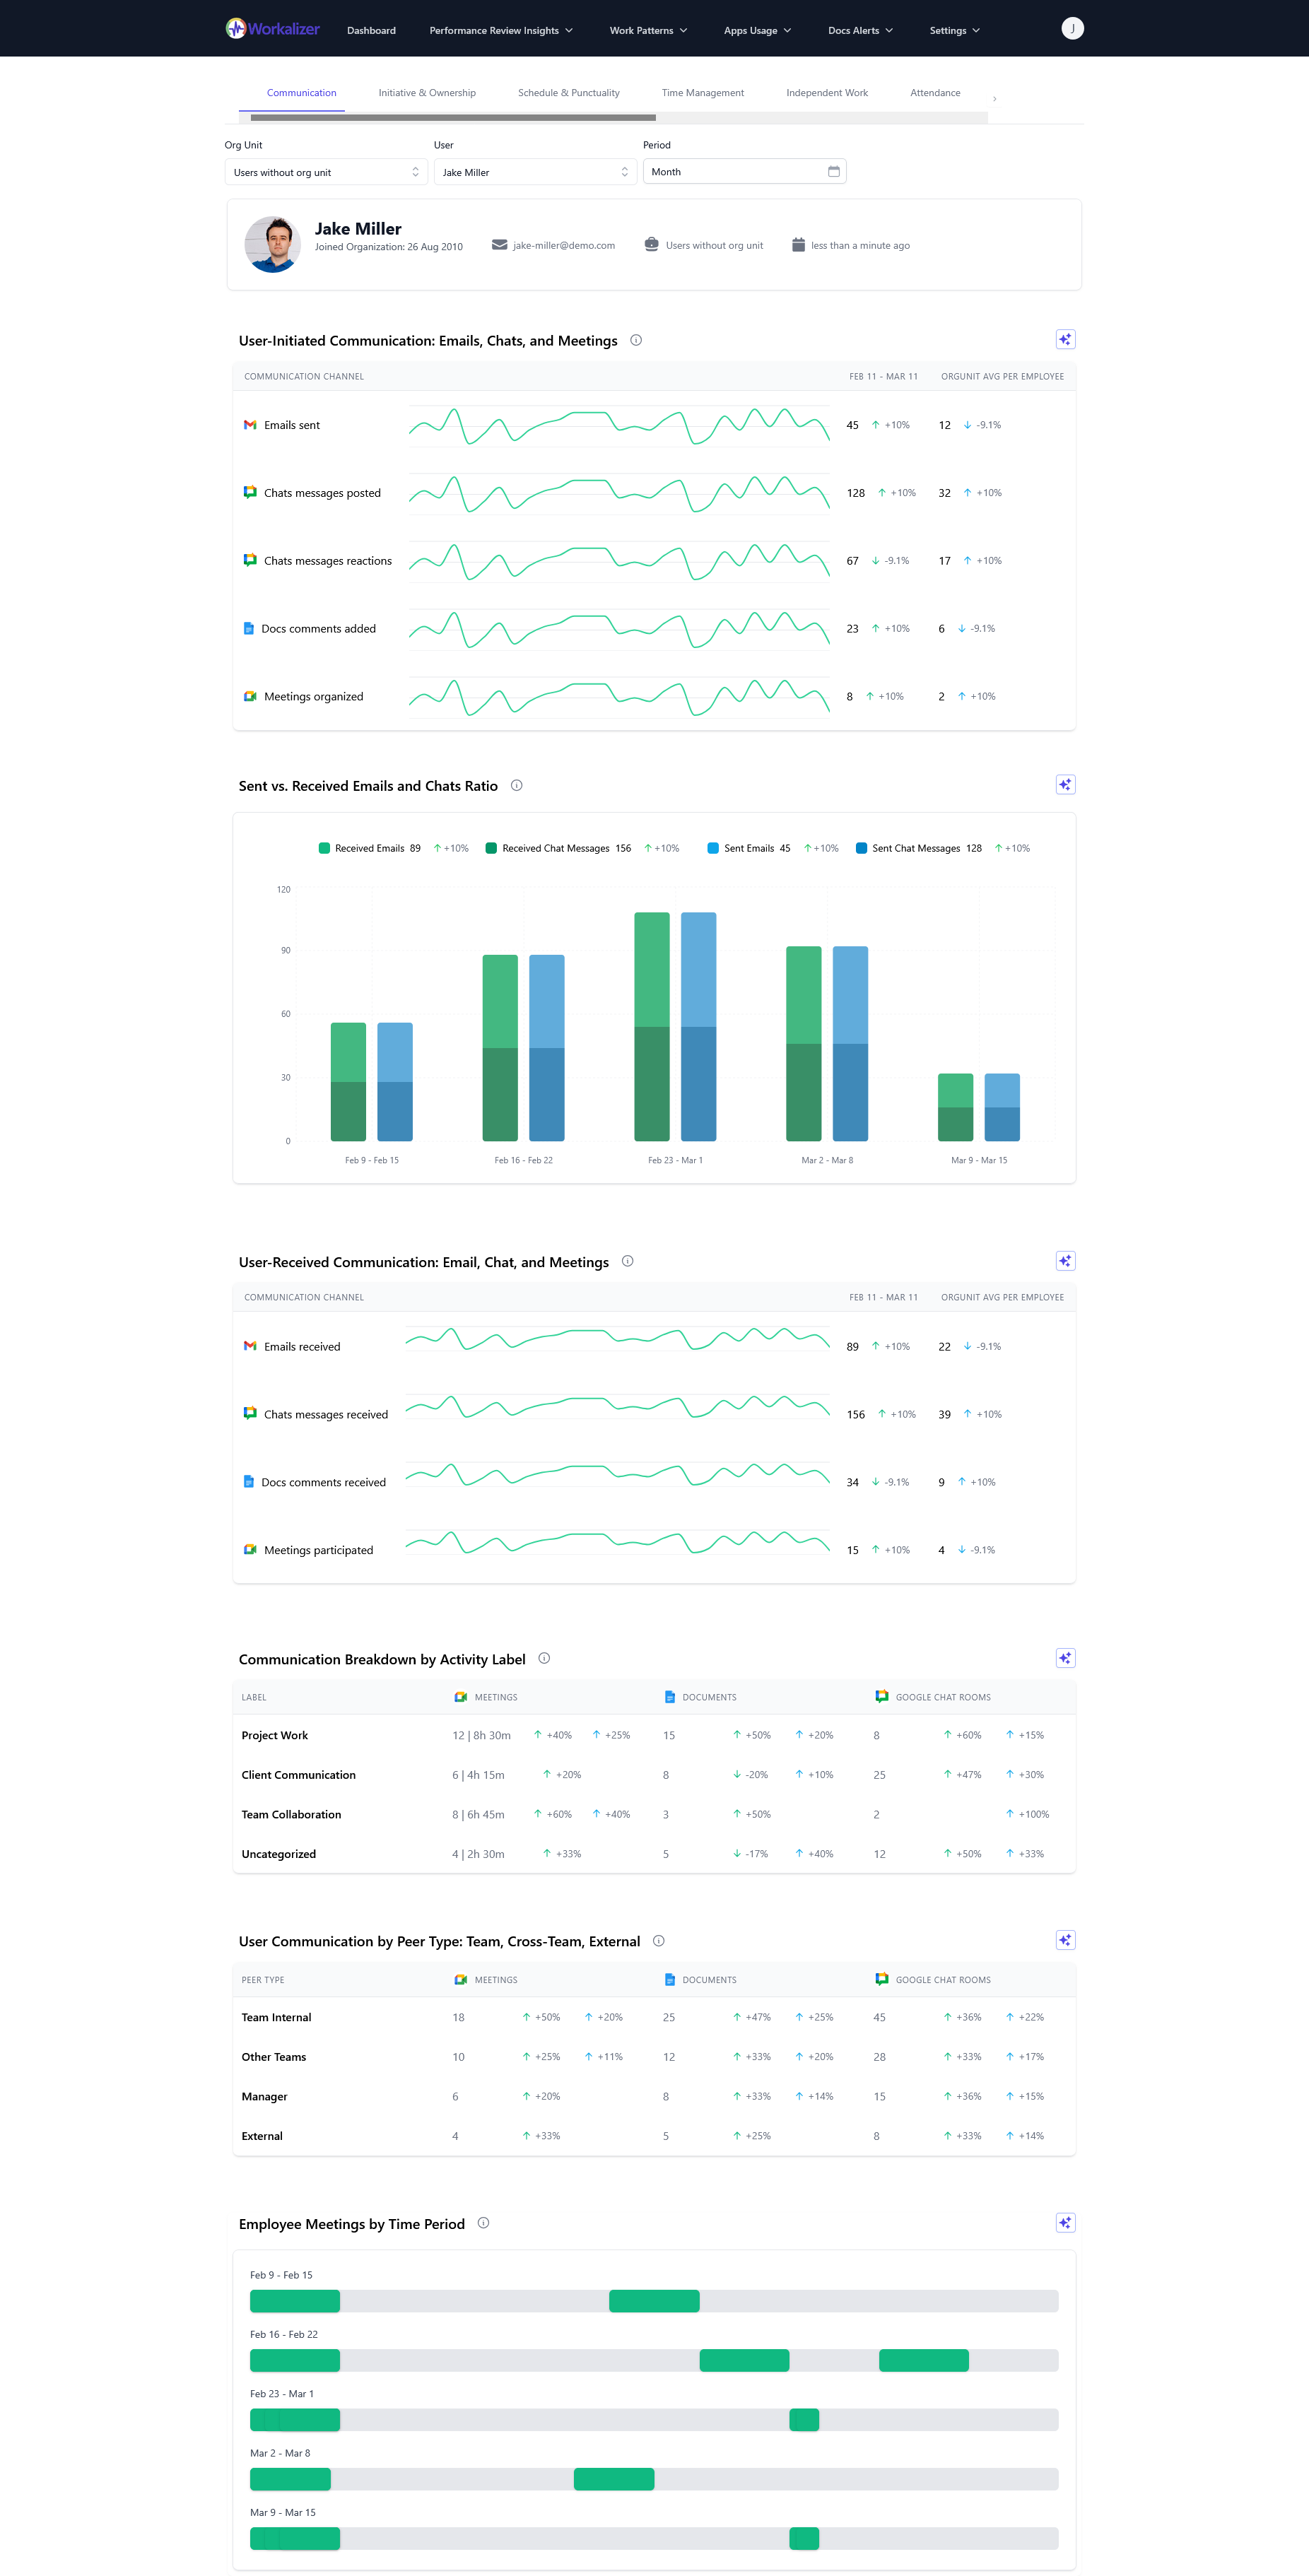
Understanding your team's performance metrics is paramount, and clarity in data presentation is key. This week, we've rolled out a series of thoughtful improvements to our dashboards and widgets, making your data more readable, intuitive, and actionable. These updates are designed to give you a clearer picture of your team's activities, from communication patterns to collaborative time, and even detailed breakdowns of events like the duration google meet sessions.
We've fine-tuned several elements across various widgets, including:
- Improved Tooltip Visibility: Tooltips on percentage change arrows and numerical values are now more prominent and consistent across all relevant widgets. This means when you hover over an indicator showing a percentage increase or decrease, you'll get a clear, immediate explanation, making data interpretation faster and more accurate.
- Enhanced Visual Cues: We've increased the size of percentage change arrows, making them easier to spot at a glance. Furthermore, all negative percentage change indicators are now consistently colored red, providing an instant visual cue for areas that might require attention.
- Bolder Data Presentation: Key values within legends, such as those in the "Sent vs. Received Emails and Chats Ratio" and "Communication Distribution by Weekdays" widgets, are now displayed in bold. This subtle yet impactful change ensures that crucial numbers stand out, improving readability and helping you quickly grasp significant data points.
These refinements are especially valuable when analyzing detailed reports, such as your gmeet attendance report. When you're looking at trends in meeting participation or the duration google meet sessions, these visual enhancements help you quickly identify anomalies or significant shifts. Our goal is to empower you with the clearest possible view of your team's activities, enabling you to make informed decisions with confidence.
The cumulative effect of these UI/UX improvements is a more polished, user-friendly dashboard experience. We believe that when data is presented clearly and intuitively, insights become more accessible, and the path to action becomes clearer. These updates reflect our ongoing commitment to refining every aspect of Workalizer to serve your analytical needs better.
Looking Ahead
These updates for the week of May 11-17, 2026, represent our continuous effort to enhance Workalizer's usability and analytical power. From streamlining your initial sign-up process to refining the visual presentation of your most important data, we're dedicated to building a platform that truly empowers you to understand and optimize your team's productivity.
We're already hard at work on exciting new features and improvements. Stay tuned for more updates, and as always, we welcome your feedback. Your insights help us shape Workalizer into the best possible tool for your needs. Visit our blog for more news and tips!