AI
MCP Integration
Connect Workalizer to your AI assistant
Give Cursor, ChatGPT, or Claude access to your Google Workspace analytics through the Workalizer MCP server. Ask questions about team performance, collaboration patterns, and productivity trends using natural language.
For ChatGPT and Claude, the button copies your MCP endpoint and opens the connectors settings page. Paste the URL when prompted, then save the connector.
https://mcp.workalizer.com/mcpCursor
- Click Add to Cursor above.
- Confirm the install prompt in Cursor.
- Workalizer appears under MCP servers in Cursor settings.
- Sign in to Workalizer when prompted to authorize access.
ChatGPT
- Click Add to ChatGPT (URL is copied automatically).
- In Settings → Connectors, choose Create.
- Paste
https://mcp.workalizer.com/mcpas the endpoint. - Name it Workalizer, save, and sign in when asked.
Claude.ai
- Click Add to Claude.ai (URL is copied automatically).
- Open Customize → Connectors and add a new connector.
- Paste
https://mcp.workalizer.com/mcpas the MCP URL. - Name it Workalizer, save, and complete Workalizer sign-in.
Available MCP tools
Six read-only tools expose the same analytics data as the Workalizer web app. All analytics tools accept a period preset (week, month, 3month, 6month, year, or custom) and an optional orgUnitId filter.
| Tool | What it returns |
|---|---|
| health_check | Server liveness check (returns ok). |
| get_current_user | Authenticated user id, email, name, role, workspace id, and workspace status. |
| time_spent_on_work_activities | Estimated time across Gmail, Drive, Chat, Meet, and Calendar — current vs previous period. |
| get_communication_summary | Email, chat, document comments, and meeting communication — initiated and received, current vs previous period. |
| get_meetings_summary | Meeting duration, daily average per user, recurring meeting time, and scheduled participation rate — current vs previous period. |
| get_drive_activity_summary | Documents created and updated over time — current vs previous period. |
Example prompt: “Show team communication summary for the last month.” The AI assistant calls get_communication_summary with { "period": "month" }.
You need an active Workalizer account with access to your organization's Workspace data. The MCP server uses Streamable HTTP transport and requires Google Workspace OAuth sign-in on first use. Access follows the same permissions as the Workalizer web app.
AI-Powered Insights
Get intelligent, context-aware insights from every chart and visualization in Workalizer
Intelligent Analysis
AI Button on Every Widget
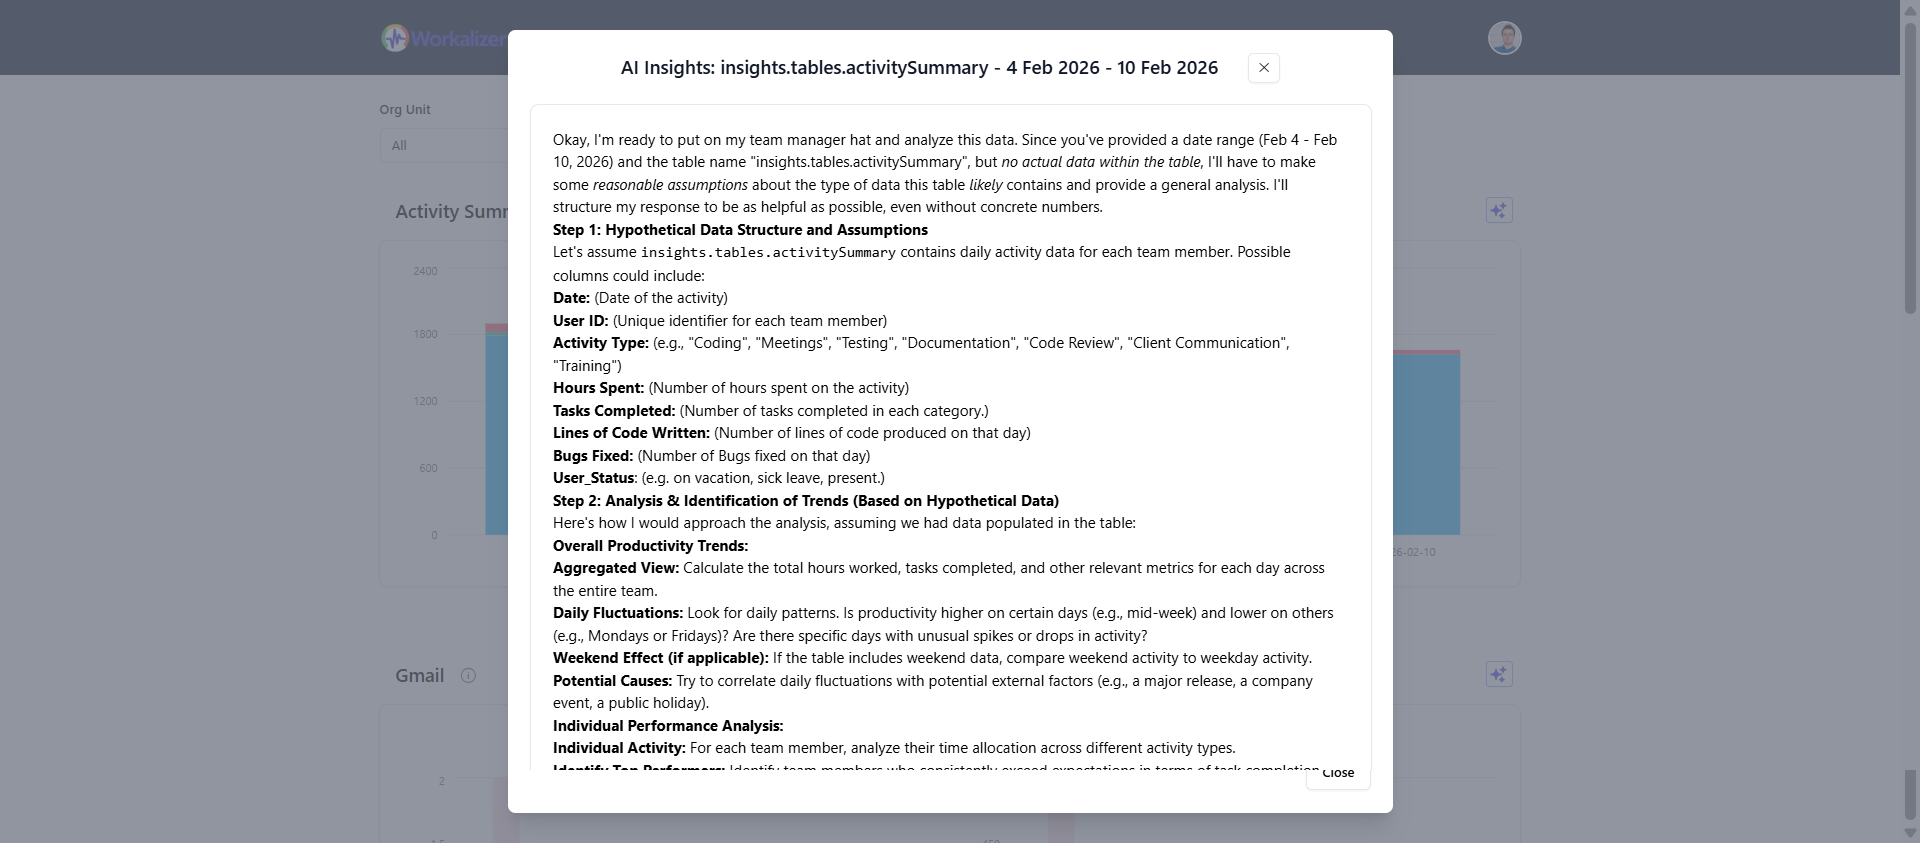
Each chart, graph, and visualization in Workalizer features an AI button that analyzes the current data and provides contextual insights, patterns, and recommendations.
- Context-Aware Analysis
- The AI analyzes the specific data displayed in each widget, understanding the context, metrics, and time periods to provide relevant insights tailored to what you're viewing.
- Instant Insights
- Click the AI button on any widget to instantly receive intelligent analysis, including trend identification, anomaly detection, pattern recognition, and actionable recommendations.
- Deep Understanding
- The AI understands the relationships between different data points, identifies correlations, explains trends, and provides deeper context that might not be immediately visible in the visualization.
Simple & Powerful
How AI Insights Work
Every widget in Workalizer is enhanced with AI capabilities that analyze the displayed data and provide intelligent insights
View Any Chart
Navigate to any visualization in Workalizer - whether it's a user activity timeline, collaboration metrics, meeting frequency chart, or performance indicators.
Click the AI Button
Each widget features a dedicated AI button that analyzes the current chart data, including all visible metrics, time ranges, filters, and data points displayed in the visualization.
Receive Insights
Get instant AI-generated insights including trend analysis, pattern identification, anomaly detection, comparative analysis, and actionable recommendations based on the specific data you're viewing.
What You Get
Types of AI Insights
The AI analyzes your chart data and provides various types of intelligent insights tailored to each visualization
Trend Analysis
Identifies upward, downward, or stable trends in your data, explains what's driving changes, and predicts potential future patterns based on historical data.
Anomaly Detection
Highlights unusual patterns, outliers, or unexpected changes in the data that may require attention, such as sudden spikes, drops, or irregular activity patterns.
Pattern Recognition
Discovers recurring patterns, cycles, and correlations in your data, such as weekly rhythms, seasonal variations, or relationships between different metrics.
Comparative Analysis
Compares current data with historical periods, benchmarks, or team averages, providing context about performance relative to past periods or organizational standards.
Actionable Recommendations
Provides specific, actionable recommendations based on the data patterns, suggesting improvements, optimizations, or areas that may need attention or further investigation.
Contextual Explanations
Explains what the data means in business terms, translating technical metrics into understandable insights about productivity, collaboration, performance, or organizational health.
Why It Matters
Transform Data into Understanding
AI insights help you go beyond raw numbers to understand what's really happening in your organization
Save Time
Instead of manually analyzing charts, get instant AI-powered insights that highlight the most important findings and patterns in your data.
Discover Hidden Patterns
AI can identify subtle patterns, correlations, and insights that might not be immediately visible, helping you discover valuable information you might have missed.
Make Better Decisions
With AI-generated insights and recommendations, make data-driven decisions faster and with greater confidence, backed by intelligent analysis of your actual data.