How to Use the Google Tasks Usage Report
The Google Tasks Usage Report (Google Tasks Analytics) in Workalizer helps you understand how tasks flow through your organization: what gets opened, what gets closed, and whether your team is keeping up with incoming work. Use it to monitor completion velocity, review recent task changes, and spot workload imbalance across assignees.
Who Benefits
- Team Leads and Project Managers: To spot backlog buildup early by comparing tasks opened vs closed and to keep execution moving.
- HR and Operations: To understand task-management adoption and workload distribution trends across org units.
- Executives: To get a high-level view of task throughput without reviewing individual task lists.
Widget Access
Go to Apps Usage (/apps/) and open the Google Tasks Analytics tab. Use the top filters to set Org Unit and Period. You can also filter by Triggered by (assignee) and search by Task title/keyword.
Detailed Functionality
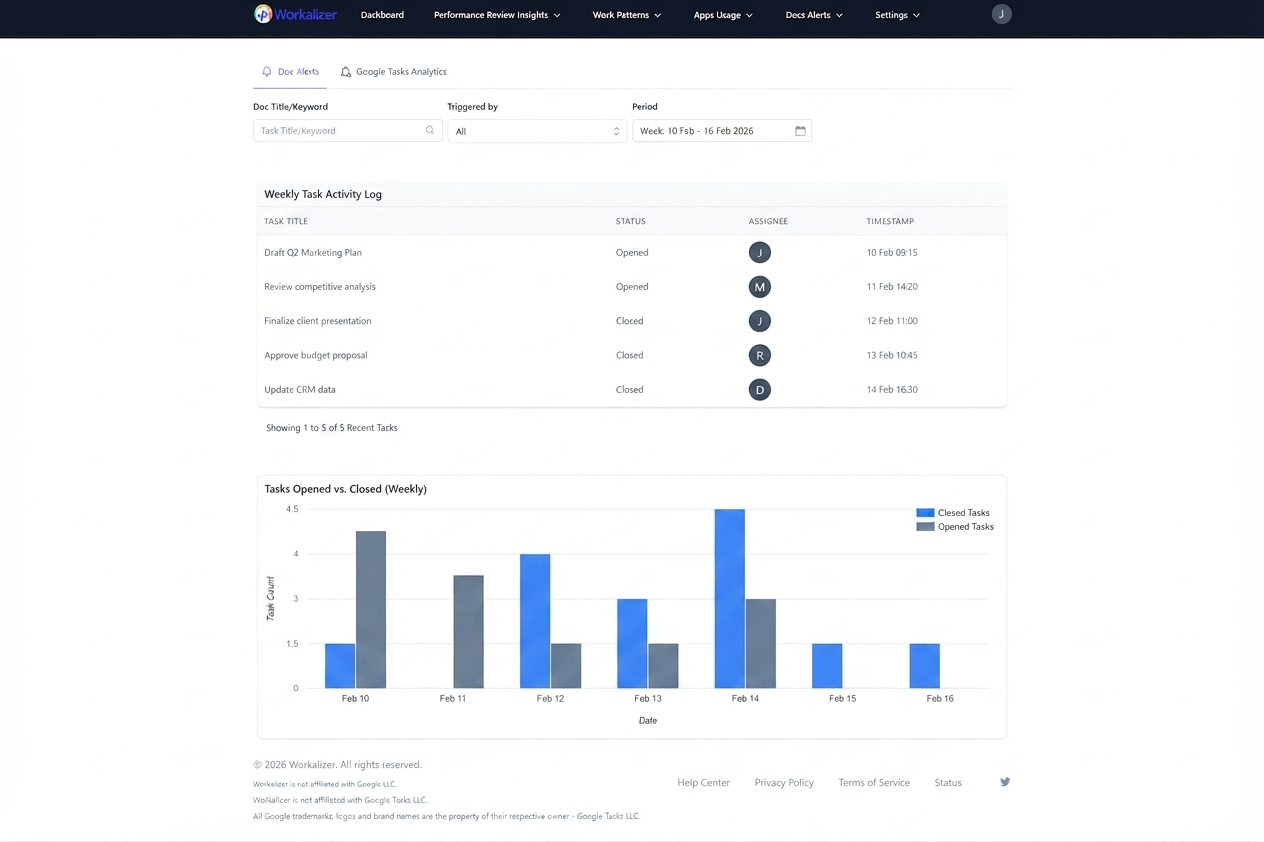
The report combines two views. The Weekly Task Activity Log lists recent tasks and whether they were Opened or Closed, including assignee and timestamp. The Tasks Opened vs. Closed (Weekly) chart compares how many tasks were opened and closed by day, helping you understand whether the team is keeping up with work intake.
Step-by-Step Guide
- Open the Google Tasks Analytics tab: Go to Apps Usage and switch to Google Tasks Analytics.
- Set Org Unit and Period: Choose the Org Unit you want to review (e.g. All or a department) and the Period (e.g. Week).
- Review recent task changes: Use the Weekly Task Activity Log to see what tasks were opened or closed, who they were assigned to, and when the activity happened.
- Check throughput: Compare the Opened vs Closed bars in the chart to see if tasks are being completed at the same pace they are being opened.
- Filter to investigate: Use Task title/keyword search to focus on a project or initiative, or use Triggered by to understand workload and completion patterns for a specific assignee.