FAQ
Frequently asked questions about activity analytics, Gmail and Chat metrics, performance reviews, document alerts, and Google Workspace insights.
How much time are users spending interacting with AI tools?
The 'Power AI Users' widget explicitly displays the total time spent by each user interacting with AI tools. This data is presented in hours and minutes, o…
Which organizational units show the highest/lowest AI adoption rates?
By utilizing the 'Org Unit' filter in the 'Power AI Users' widget, you can analyze AI usage data at a departmental or team level. This enables you to compa…
What are the overall trends in AI invocations and time spent across the organization?
To understand overall trends, set the 'Org Unit' filter to cover the entire organization and select various 'Period' options (e.g., Week, Month, Year). The…
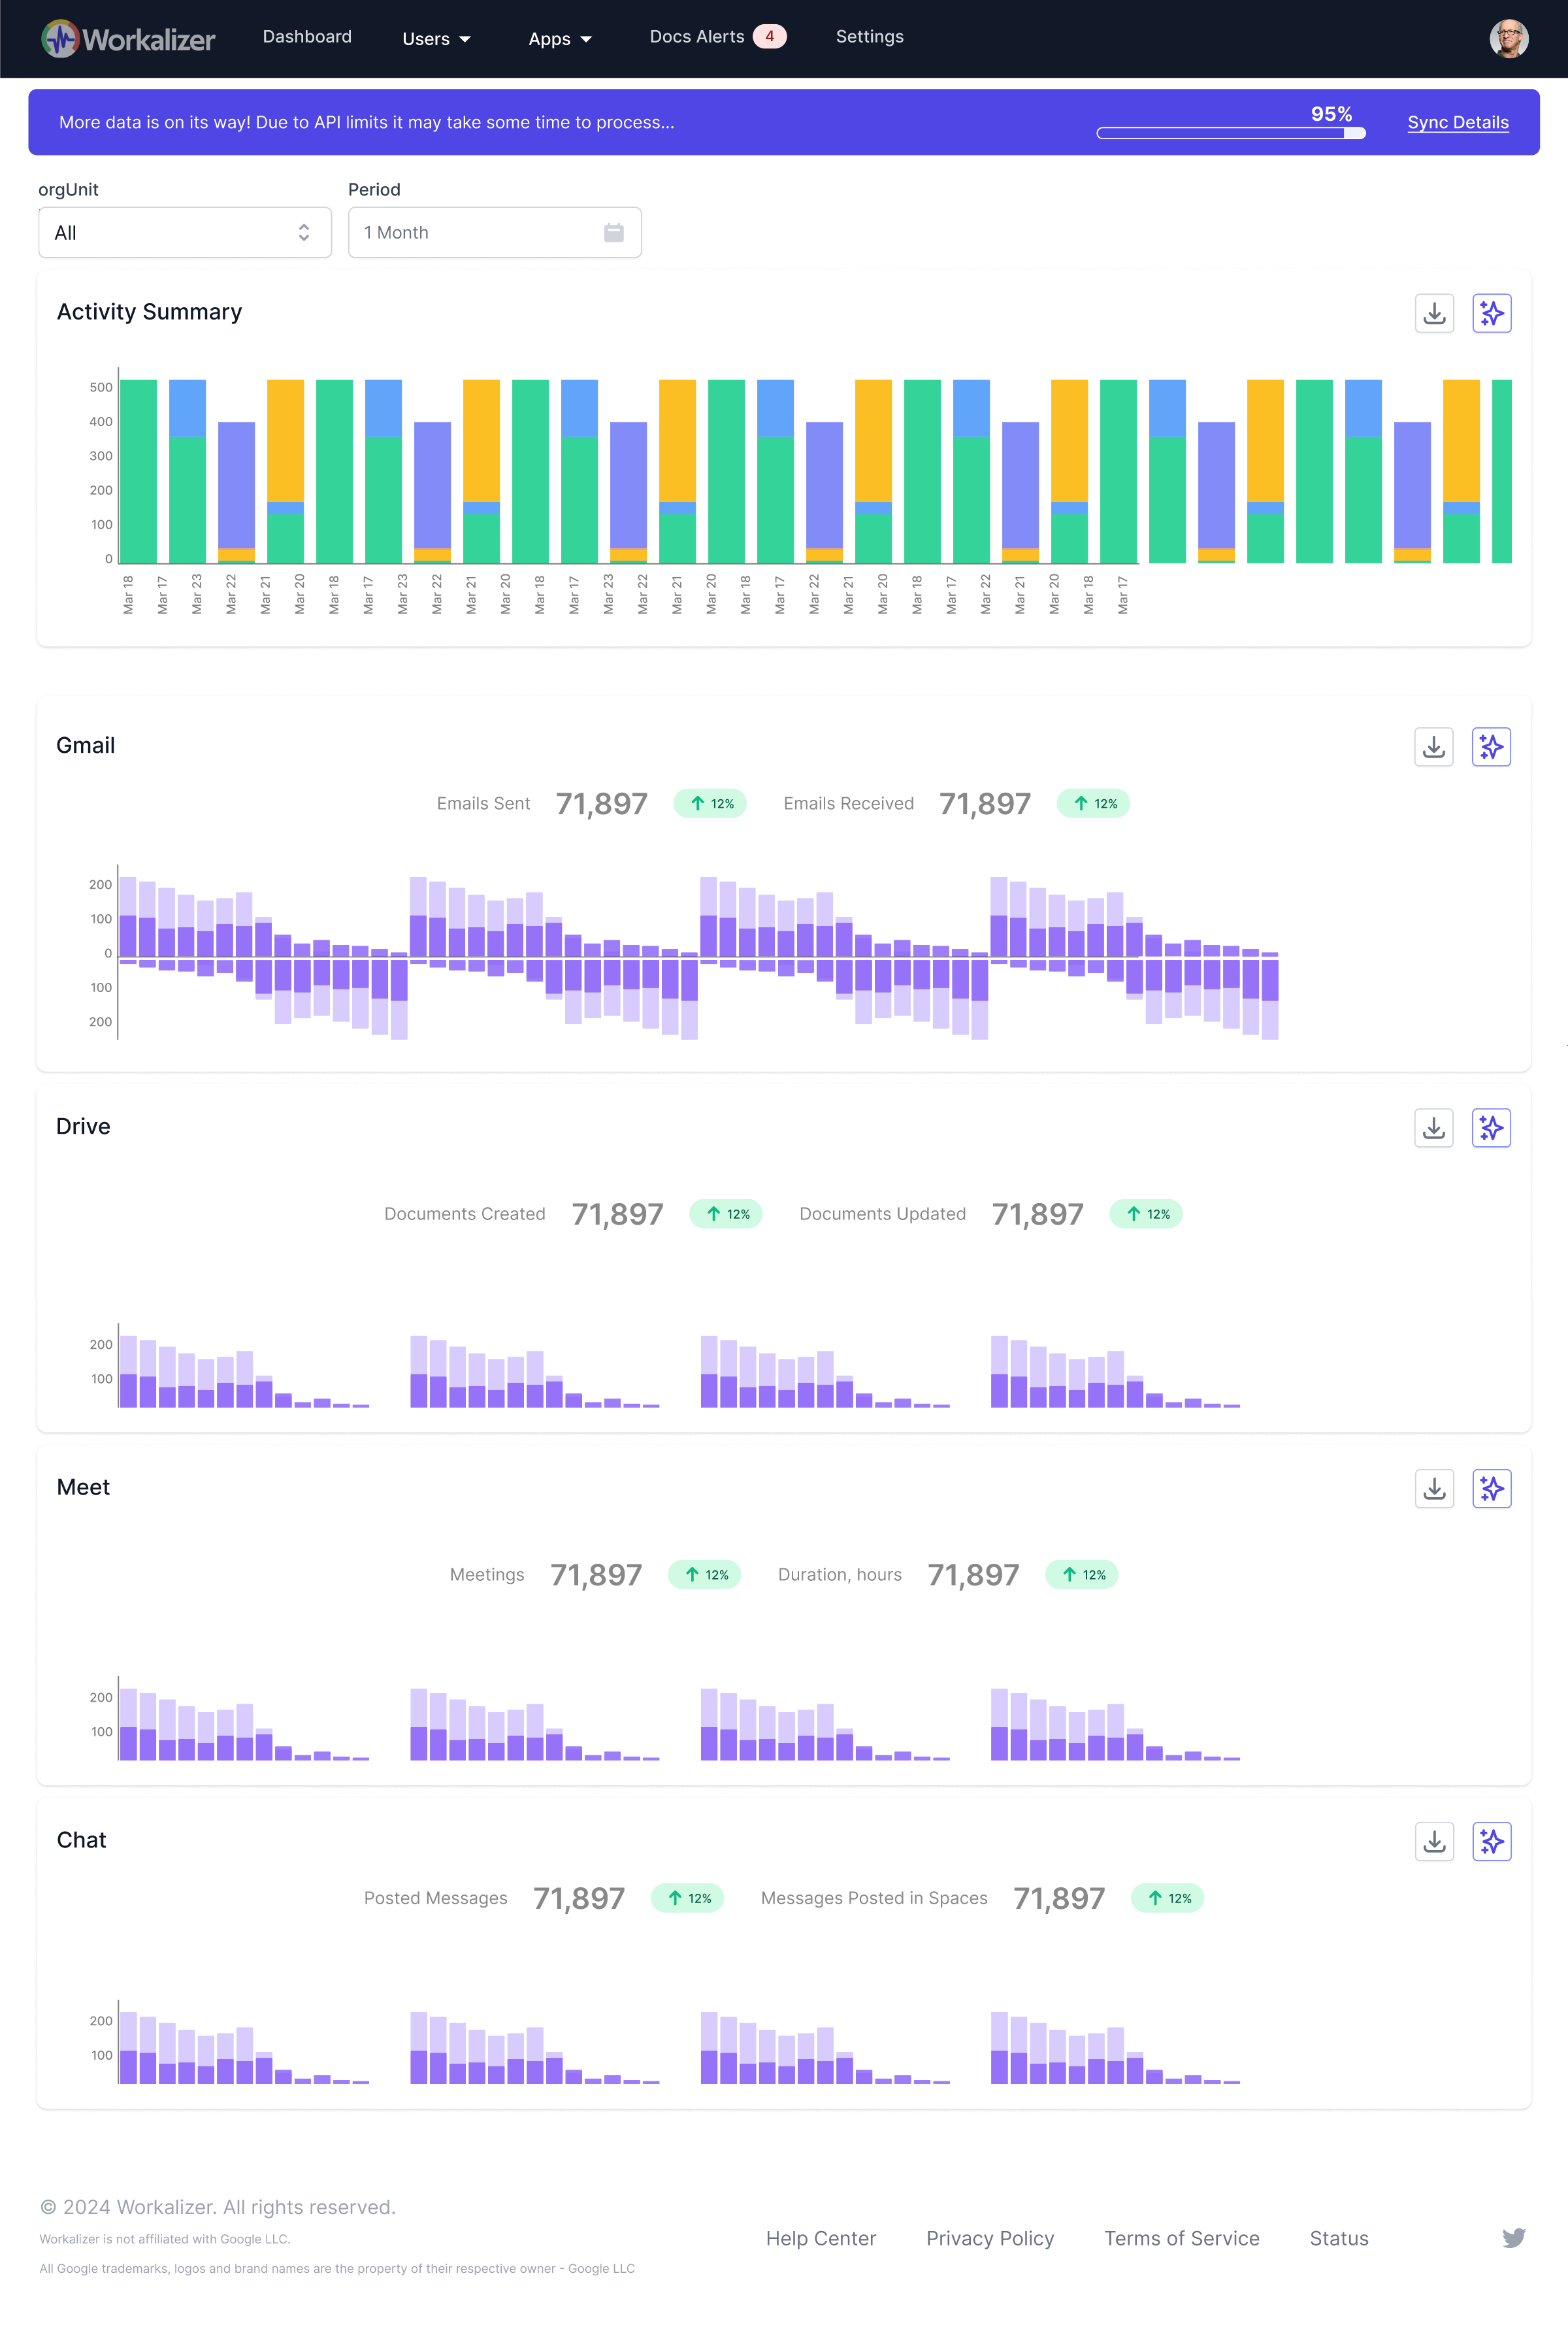
How many emails are being sent and received by my team/organization over a given period?
The Gmail Usage Trend widget visualizes the exact counts of emails sent and received for your selected team or organization. You can choose various periods…
Are we receiving significantly more emails than we are sending, or vice-versa?
The bar chart in the Gmail Usage Trend widget clearly distinguishes between 'Emails Received' (blue bars) and 'Emails Sent' (green bars). By comparing the …
What are the busiest periods for email communication?
The Gmail Usage Trend widget graphically displays email activity over chosen time intervals. The tallest bars on the chart indicate periods of highest emai…
How has email activity changed over the last week, month, or quarter?
The widget allows you to select various historical periods such as 'Week', 'Month', '3 Months', '6 Months', or 'Year'. By choosing these filters, you can o…
What actionable insights can AI provide regarding our email usage trends?
The 'AI Insights' button within the Gmail Usage Trend widget leverages artificial intelligence to analyze the displayed email data. It provides automated, …
When is my team or organization most actively interacting with documents?
The Documents Bar Chart visually represents document activity over selected periods. By using the 'Period' filter (e.g., 'Week', 'Month', 'Custom'), you ca…
Which organizational units or individual users are contributing the most to document activity?
You can identify top contributors by applying the 'Org Unit' and 'User' filters. When 'Org Unit' is set to 'All', the chart shows breakdown by units. Selec…
What specific types of activities are associated with document usage in my department?
The 'Activity Label' filter allows you to see how different types of activities (e.g., 'Project Work', 'Client Communication') are associated with document…
Are there any significant changes or unusual trends in document usage over a selected period?
Yes, the Documents Bar Chart is designed to highlight trends. By comparing bar heights and patterns over various time 'Periods', you can spot significant c…