FAQ
Frequently asked questions about activity analytics, Gmail and Chat metrics, performance reviews, document alerts, and Google Workspace insights.
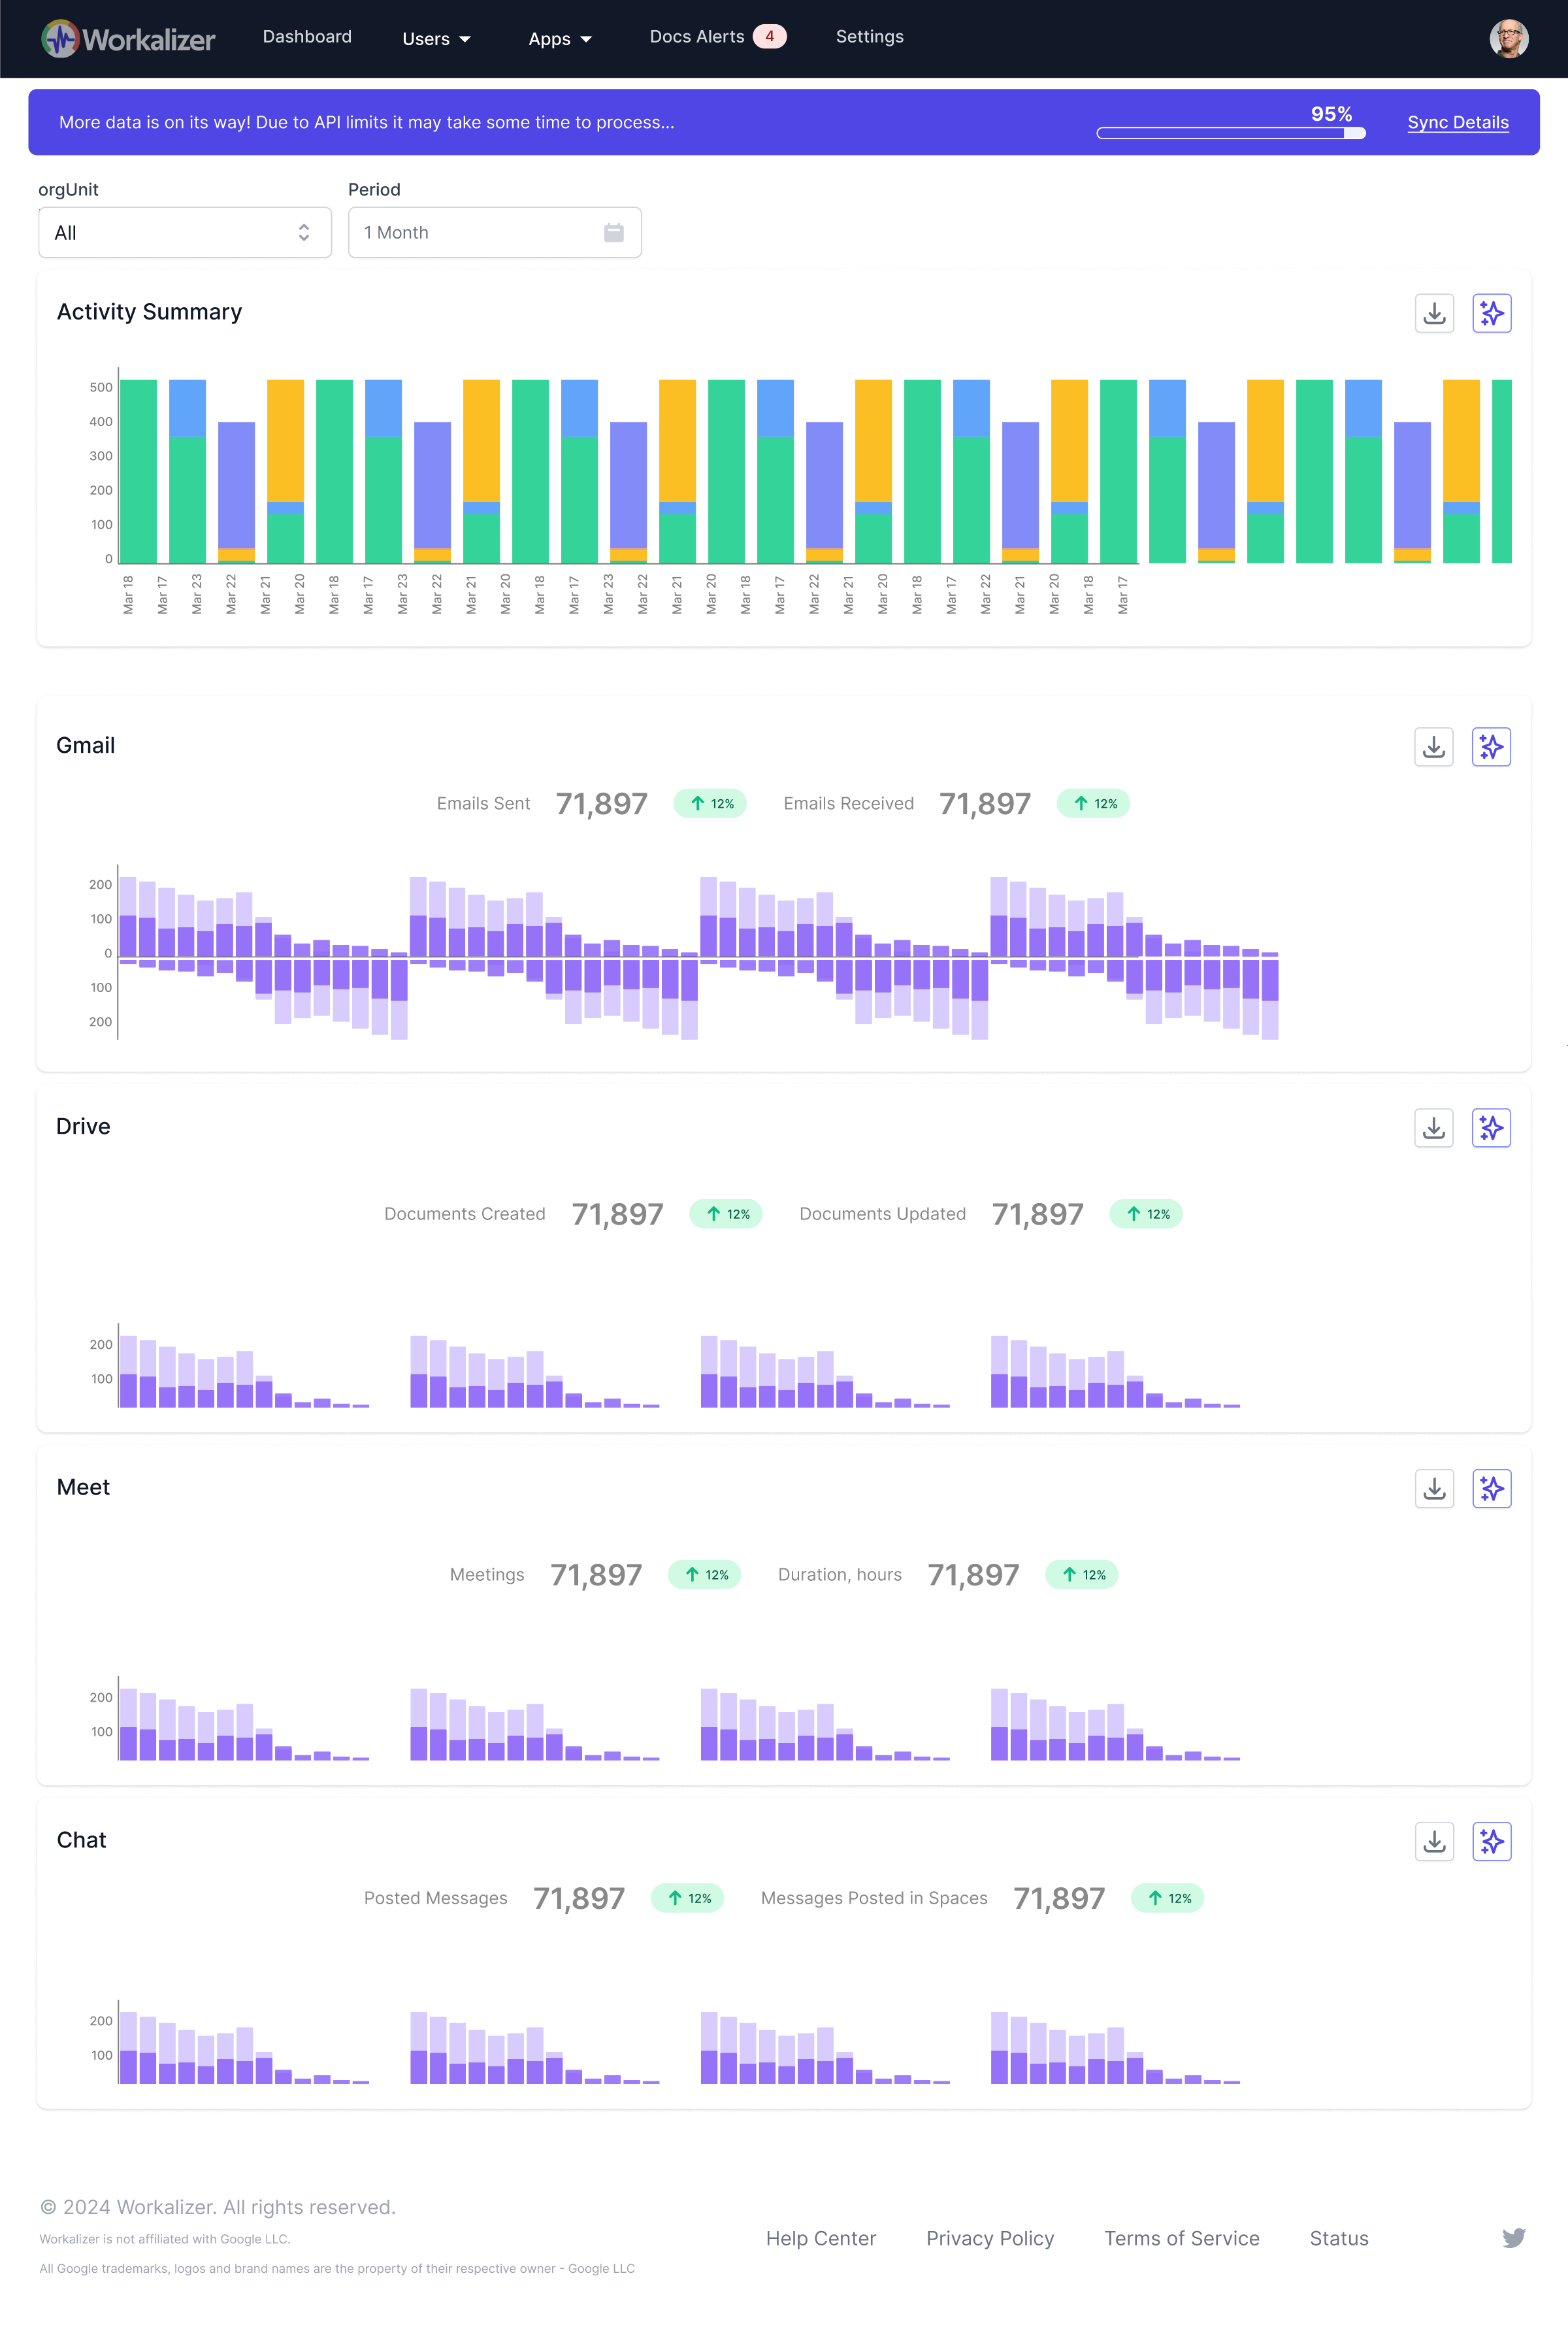
How has AI usage changed over time for specific applications?
Each metric (Invocations and Time Spent) includes a percentage change comparison to the previous period. You can also use the 'Period' filter (e.g., Week, …
What is the collective time spent by our team using AI in each app?
The 'Time Spent' column for each Google Workspace app provides the collective duration spent with Gemini AI. This metric is crucial for understanding the d…
Are there significant trends in AI adoption across our organization?
Yes, by utilizing the 'Org Unit' filter, you can analyze AI adoption across the entire organization or drill down into specific departments. Combined with …
How can we get actionable insights to boost AI adoption and efficiency?
The widget features a star icon (AI Insights). Clicking this provides AI-generated analytical summaries and actionable recommendations based on the display…
How Often is Gemini Invoked?
The "Number of Invocations by Action" widget provides a detailed count of how frequently Gemini is invoked across all integrated Google Workspace applicati…
Highest/Lowest Gemini App Usage
The widget's stacked bar chart visually segments invocations by application (e.g., Gemini App, Chat, Docs, Gmail, Drive). By examining the relative sizes o…
Current vs. Previous AI Invocations
For each time interval displayed, the widget shows two bars: one for the current period and a slightly transparent one for the previous period. This direct…
AI Adoption Trends Over Time
Yes, by comparing the current and previous period bars across multiple time intervals, you can identify significant increases or decreases in AI invocation…
AI Usage Variation by Org Unit/User
The widget allows you to apply filters for 'Org Unit' and 'User'. By selecting different organizational units or individual users, you can analyze how AI i…
AI Insights for Productivity
The widget provides an 'AI Insights' button that generates AI-driven analytical tips based on the displayed data. These insights can highlight patterns, su…
Who are the top AI users in my organization/department?
The 'Power AI Users' widget displays a ranked list of users based on their AI invocation count and total time spent interacting with AI tools. You can easi…
How has an individual's AI usage changed compared to the previous period?
The 'Power AI Users' widget provides comparative data for each user. Alongside their current AI invocation count and time spent, you'll see a percentage ch…